The HATPI survey
(courtesy of Prof. Gaspar Bakos)
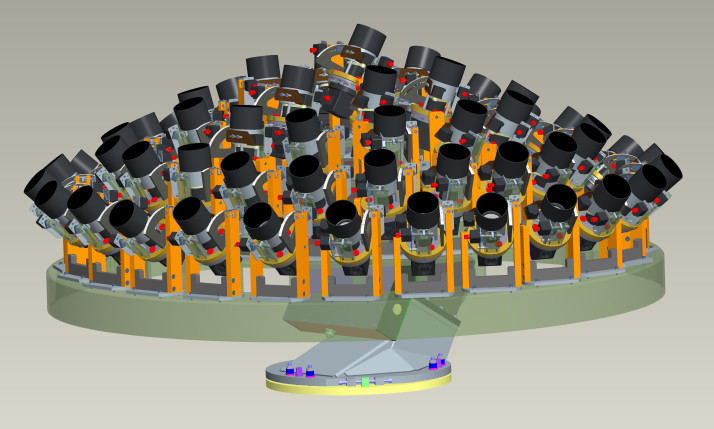
The HATPI survey, led by Prof. Gaspar Bakos at Princeton University, will be an all-sky time-series photometry survey operating at very high cadence (30 seconds between each full night sky frame) and at high precision (better than 2.7 milli-magnitude precision per 30 second exposure for 9th magnitude stars). The envisioned design puts together a large number of off-the-shelf lenses attached to high quality back-illuminated CCD cameras, which all sit on a custom-designed mount designed for super-precise tracking. The lenses will be arranged such that the entire visible night sky accessible from HATPI's site at Las Campanas Observatory in Chile is covered in a single (multiple camera) exposure. We aim to build a pipeline that can keep up with this massive data rate, and can deliver on the science promise this unique instrument holds. I've been working on a prototype of this pipeline (building on work done by the HATNet and HATSouth teams) for the last year or so. Below is a brief overview of the current design of the photometry pipeline, and some results obtained from its deployment during initial testing of some HATPI instrument components.
The photometry pipeline
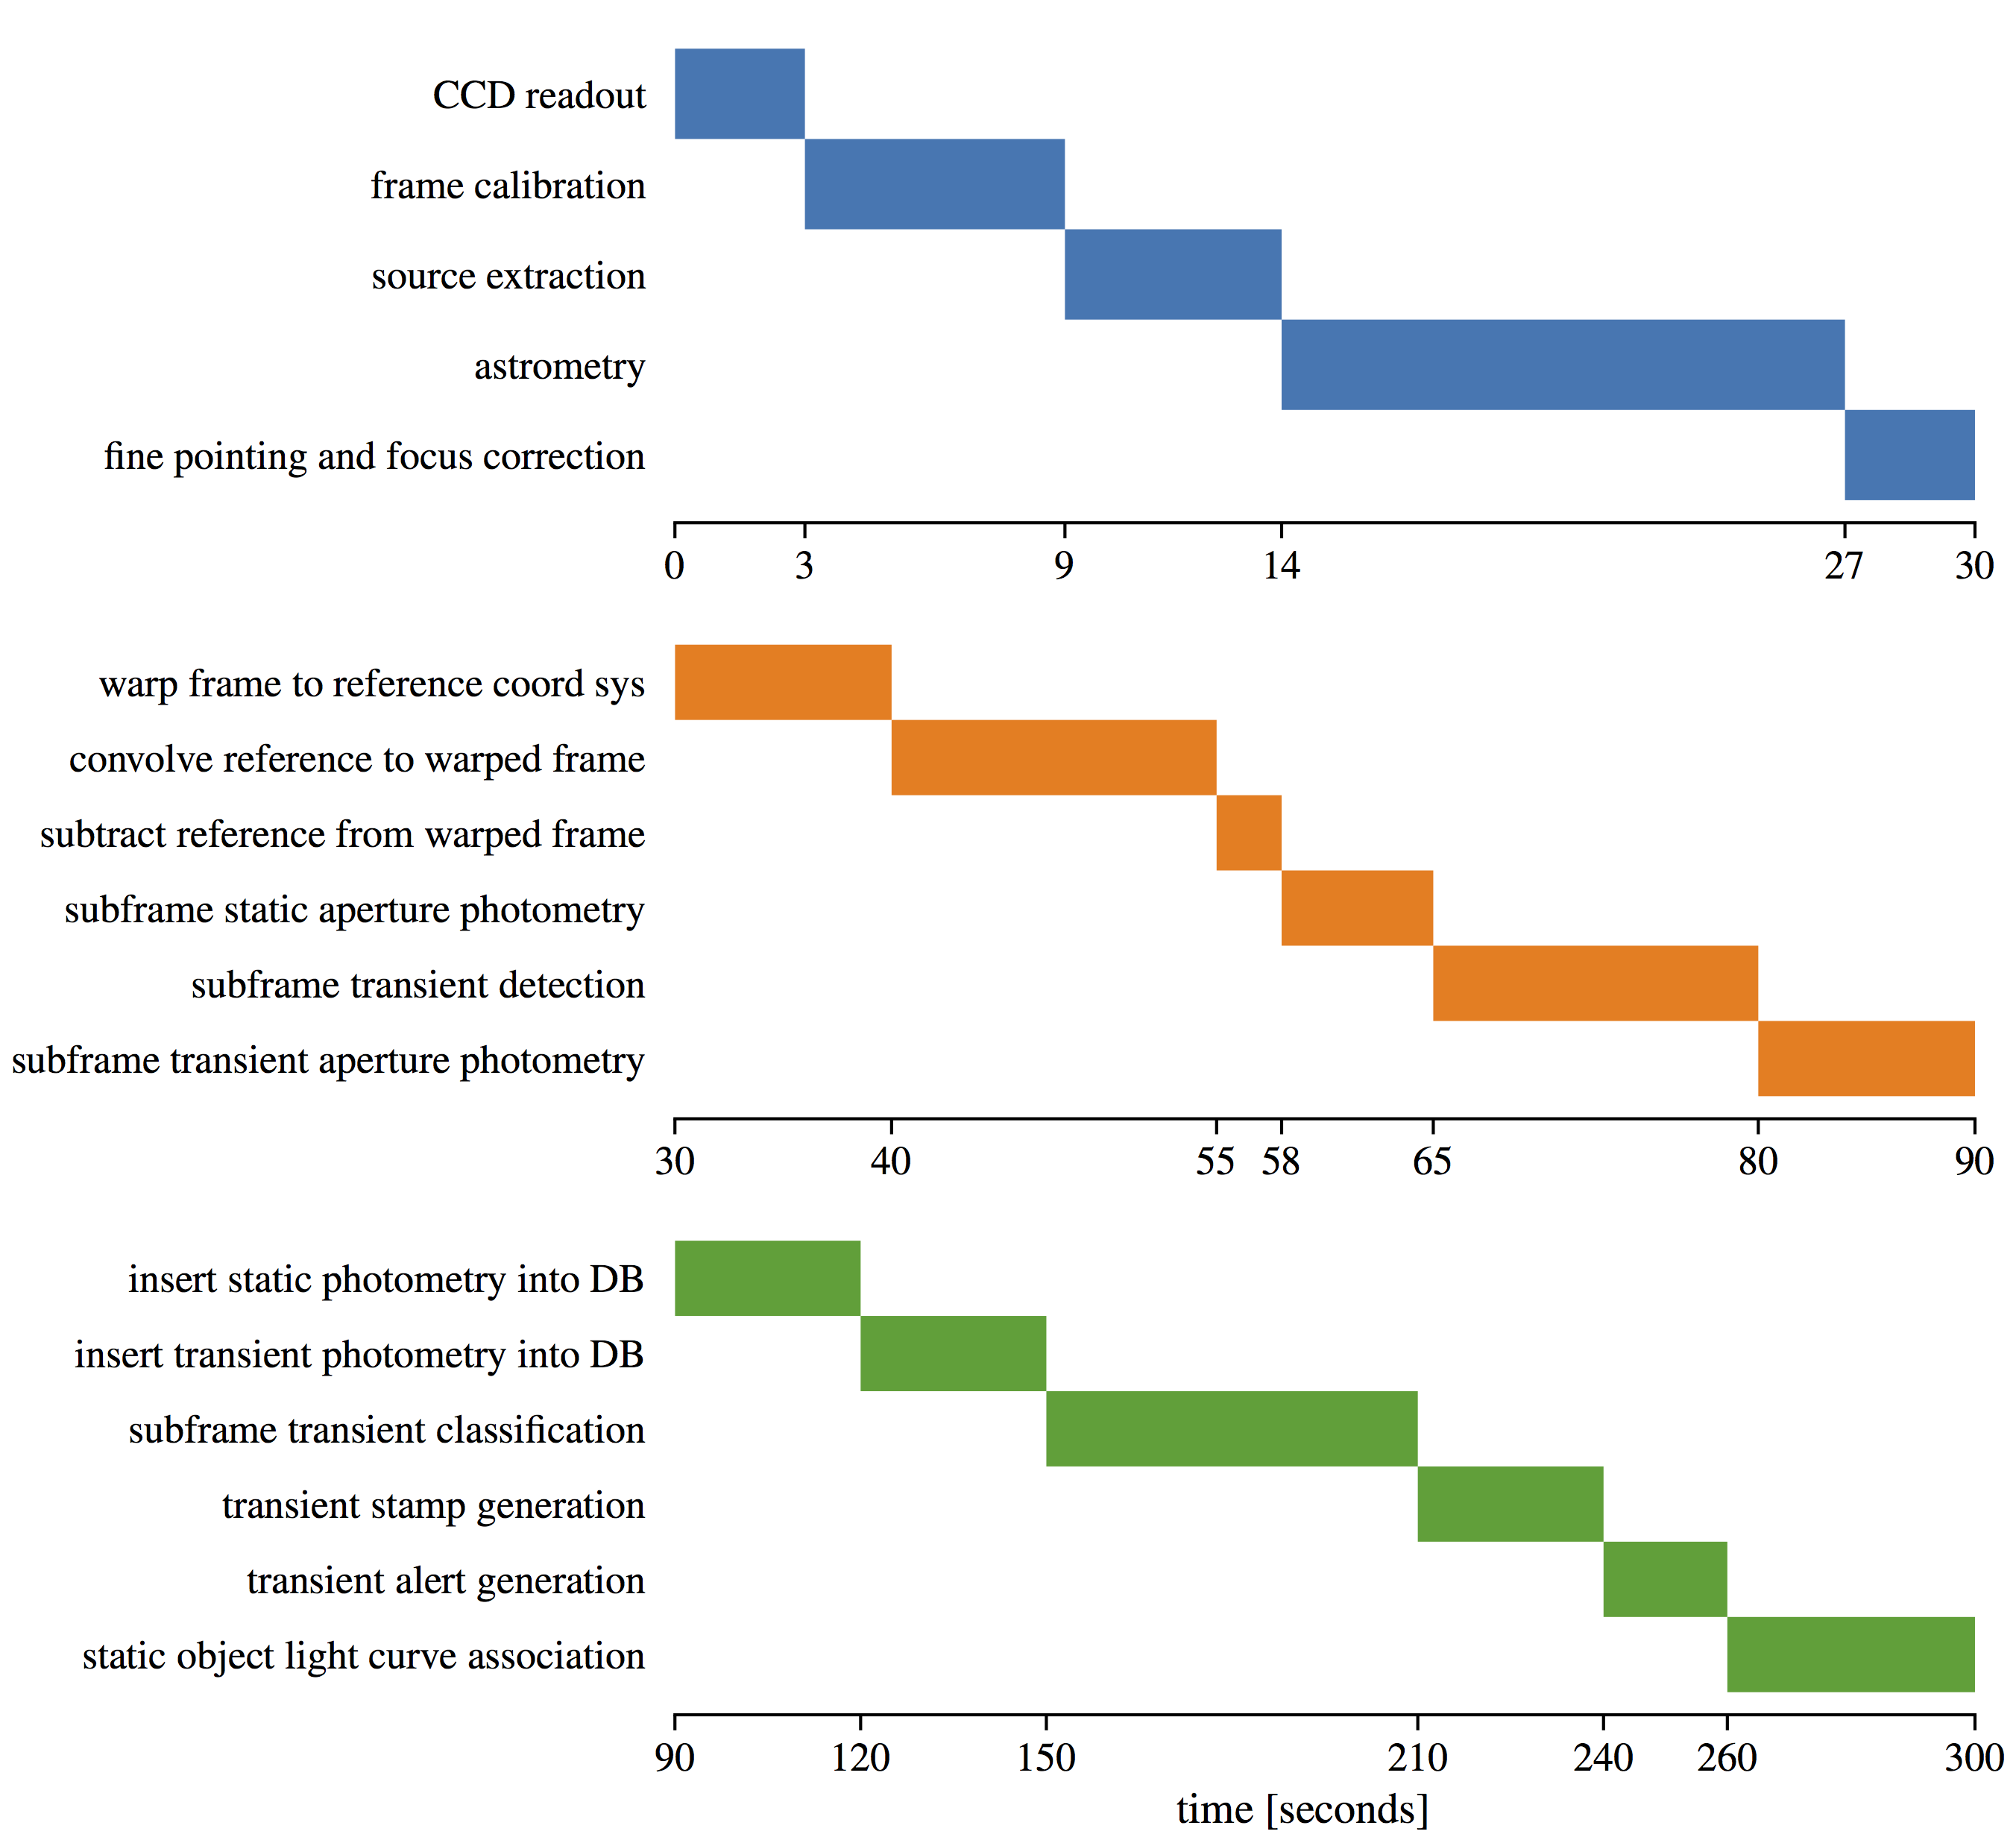
The HATPI pipeline, which we affectionately call PIPE-TrEx, is composed of three parts: (i) the Photometric Engine to reduce the image stream to photometry data at various cadences, (ii) the Transient detection and classification stage, and (iii) the External transient and light curve interface. An overview of the data flow through the entire system, along with the timing requirements for processing is shown in the figure below.
All pipeline components are implemented as Python wrappers around lower-level photometric reduction routines written in C and battle-tested in the existing HATNet and HATSouth surveys. The architecture is a service mesh, bound together with Redis for queueing jobs, Slurm for launching long-lasting batch jobs, and Cassandra for the underlying storage of photometric data. We'll use Ceph for storage of the image files themselves. All of these run on an on-site computer cluster located next to the instrument itself.
Science from HATPI
High precision and fast cadence time-series photometry
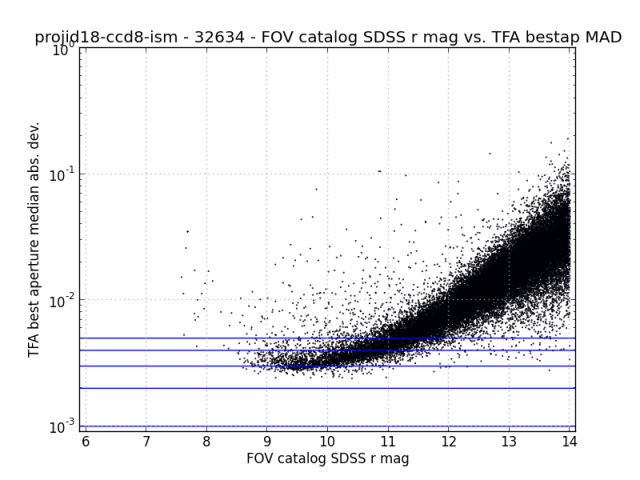
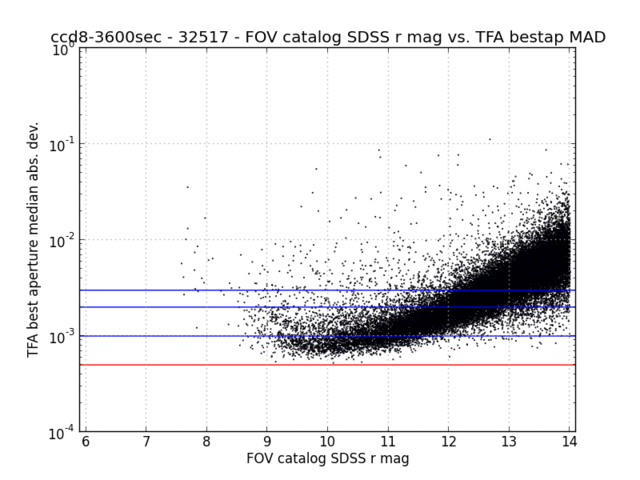
The main goal of HATPI is to provide high quality and cadence light curves using image subtraction photometry for all stars visible from the Southern Hemisphere. Since we use image subtraction photometry, we can obtain good light curves for stars in densely packed regions of the night sky, such as the Galactic Plane and star clusters. All data from the instrument will be immediately made public for the scientific community to exploit. The precision and time coverage is tuned to detect Earth-sized planets in long-period orbits around stars with masses of the Sun or smaller. We reach a best case precision of 2.7 milli-mag for 9th magnitude stars using the usual 30 second cadence of the instrument. If light curves are binned to one hour cadence, the precision improves to better than 0.7 milli-mag at the same magnitude, making us sensitive to small planets transiting in front of their parent stars. The long time baseline of the survey enables dense phase coverage of any periodic phenomena, greatly aiding in its verification and characterization (see below for examples of variable stars identified in HATPI prototype observations.)
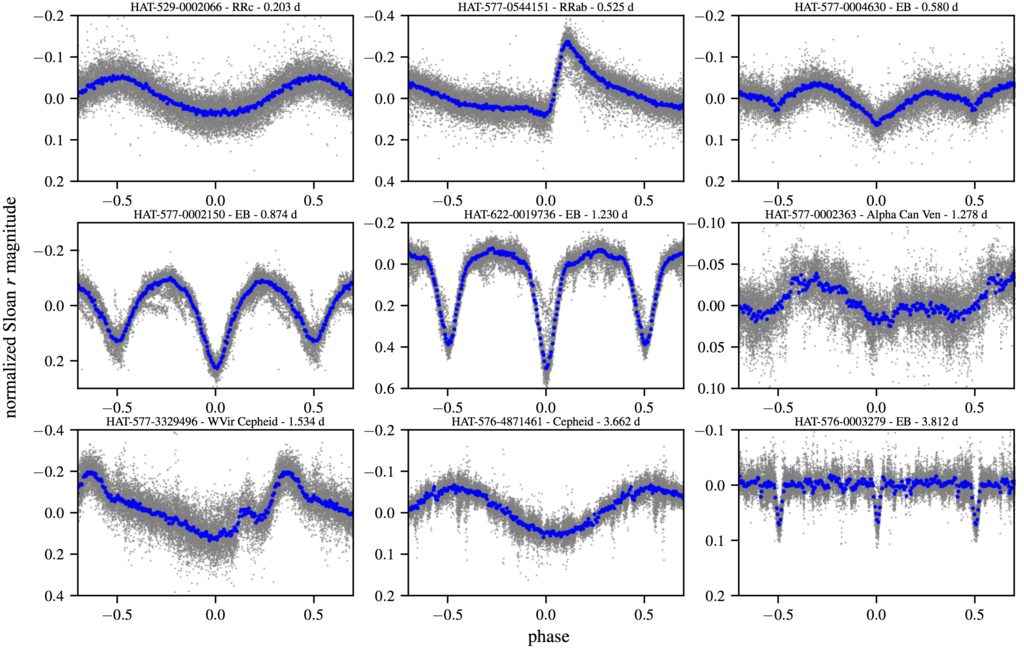
The plots below show the performance of the prototype pipeline for instrument tests carried out earlier this year, which demonstrate excellent precision. These results are very promising for the full scale implementation.
Deep stack photometry
In addition to time-series photometry, we plan to co-add aligned frames taken by the instrument, creating stacks of one hour and eight hour long effective exposures. We plan to construct light curves using these frames as well, searching for variability of fainter objects than can be detected from our 30 second exposures alone. The stacks themselves could be added together to form an ultra-deep stack representing months of effective exposure time. This would allow the identification of extremely faint structure in extended objects such as galaxies and dark filaments in clusters and nebulae. This idea has been recently used quite successfully by the Dragonfly Array, and we plan to do similar things, only over the entire sky. Below, we show examples of one and eight hour co-added deep stacks for the region near the Lagoon and Trifid Nebulae in Sagittarius. Click the images to get the full 2048 x 2048 pixel (13 x 13 degree) frames.
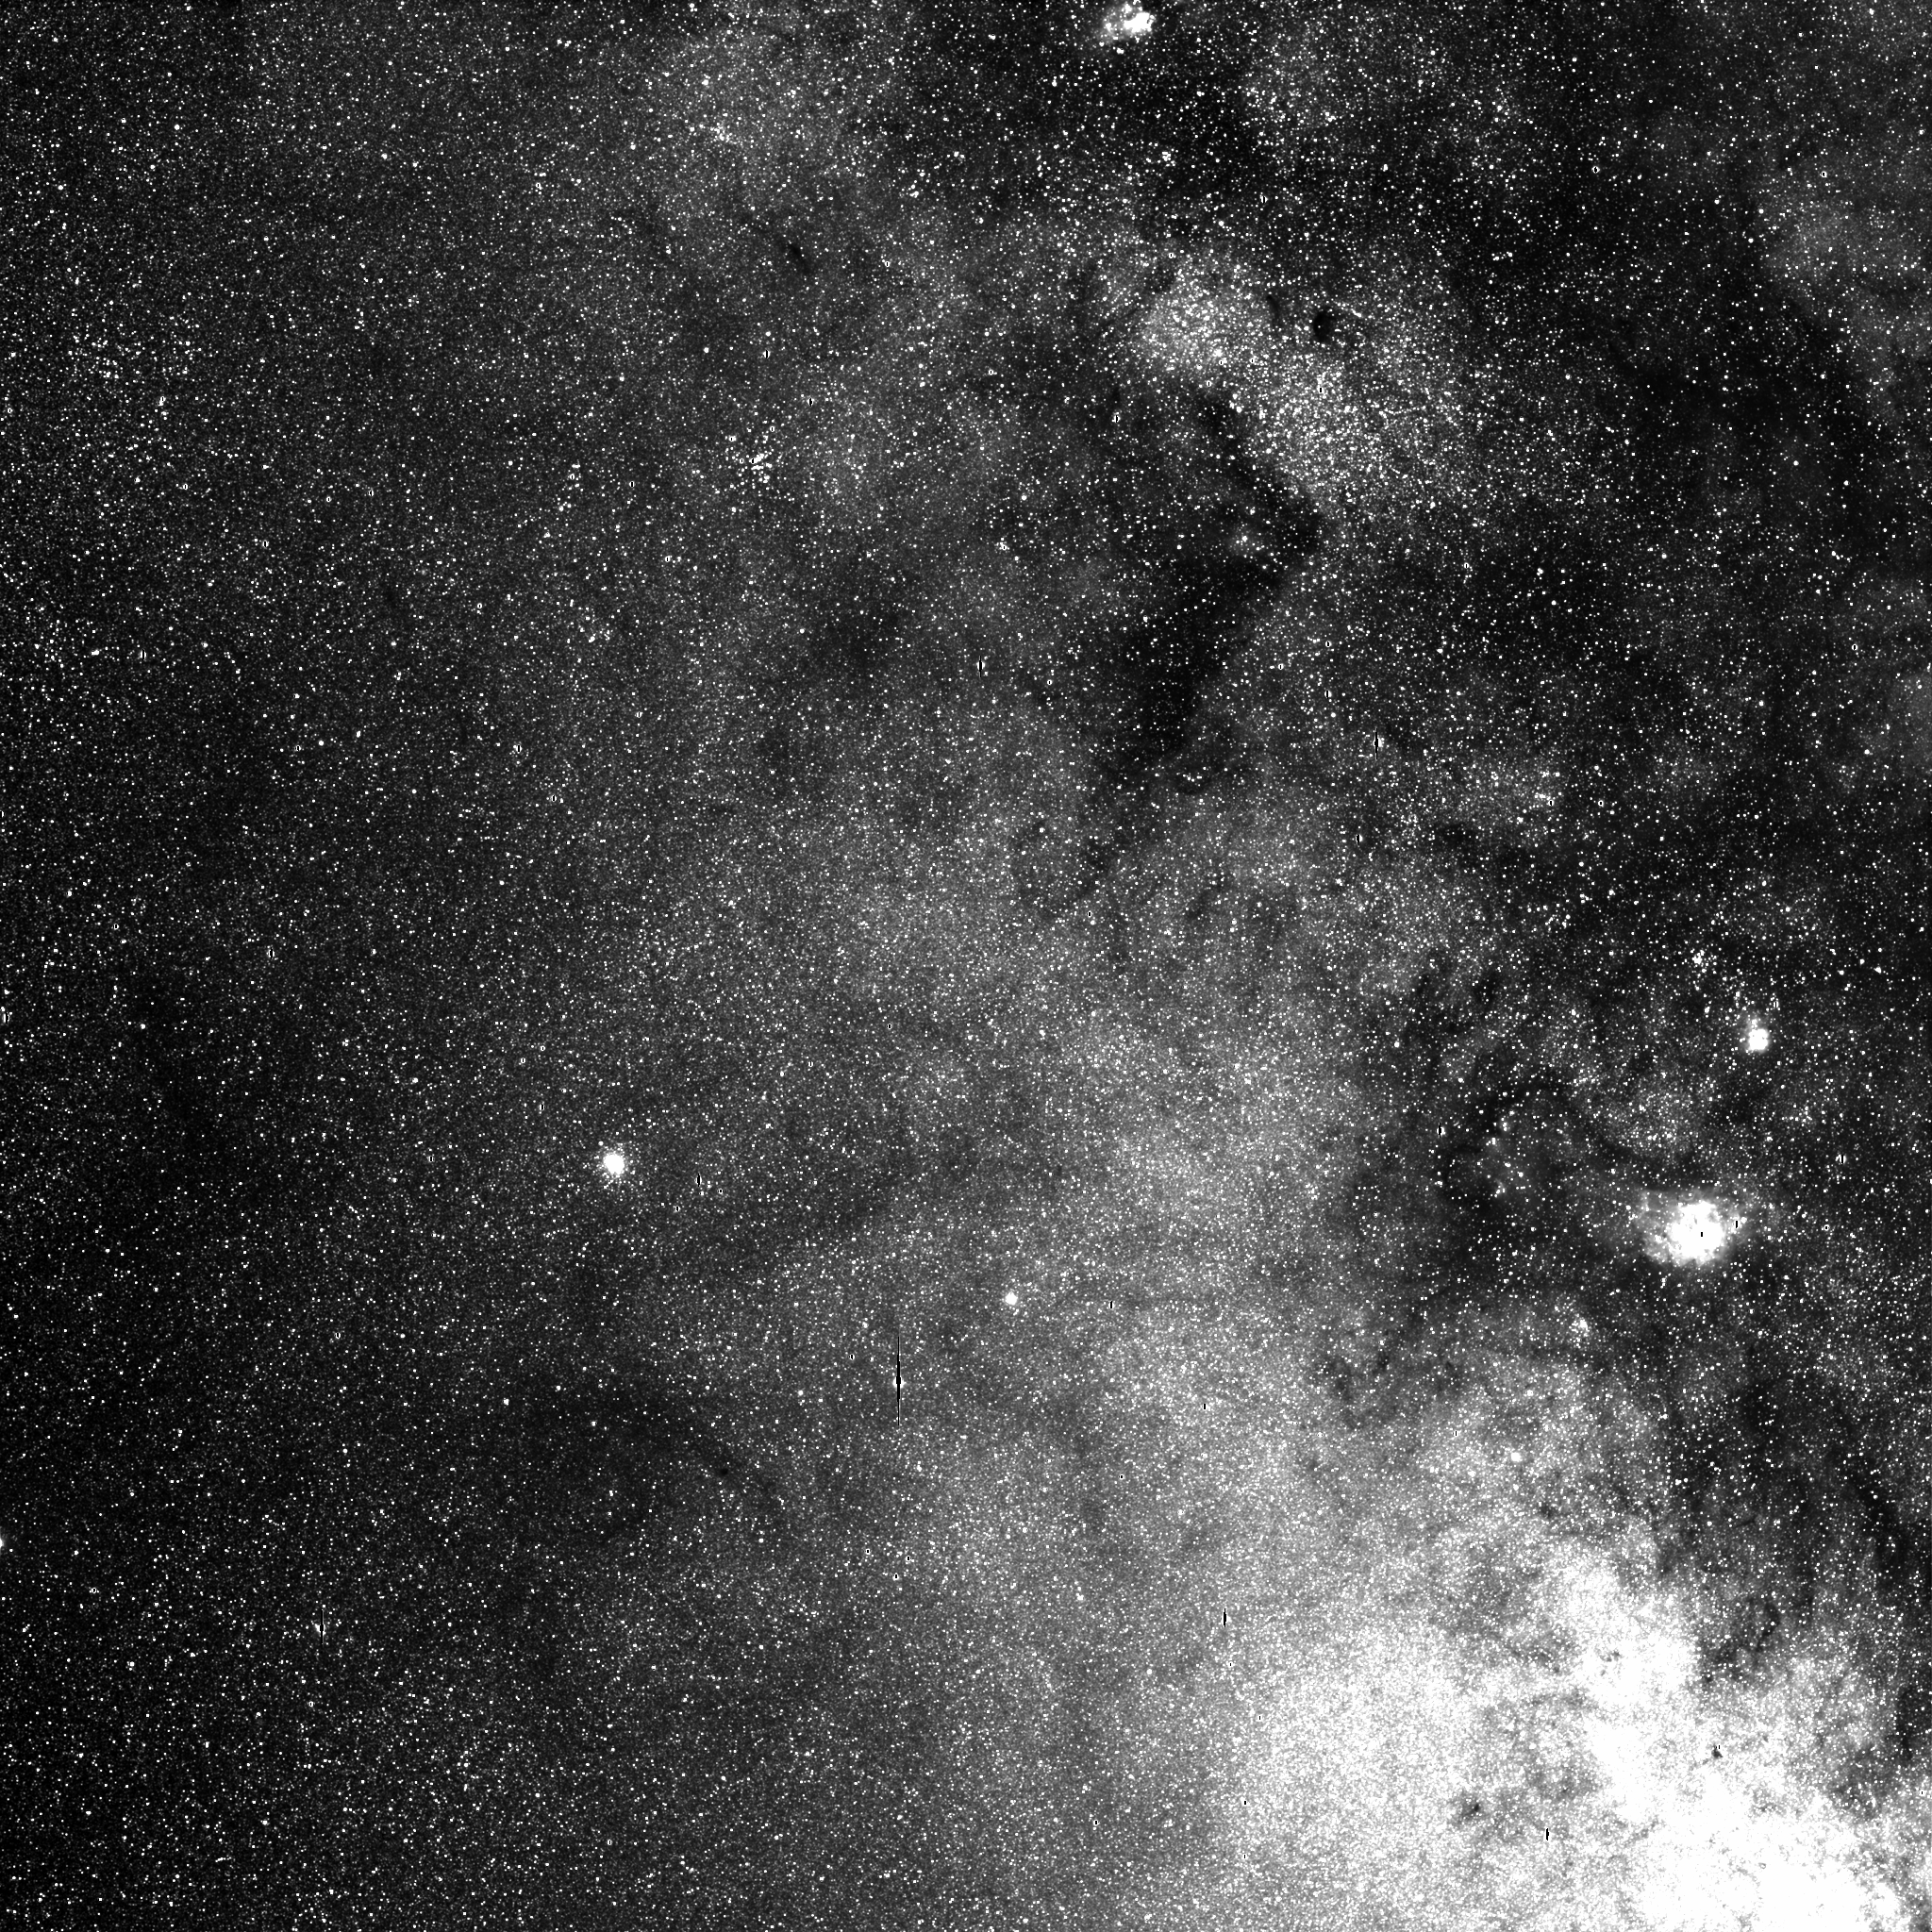
click to see full 2K x 2K frame

click to see full 2K x 2K frame
Transients and moving objects
"Transients" are a class of astronomical objects that include everything from moving objects like asteroids, stellar objects such as dwarf novae and various supernovae, to galactic-scale objects such as gamma-ray bursts and tidal-disruption events. Although transients are not the main science driver for HATPI, its high cadence photometry of the entire sky promises to turn up many of these objects. With 30 second exposures, we can reach a 5-sigma object brightness detection limit of SDSS r ~ 16.5, and with co-added one hour frames, we can reach a 5-sigma object brightness detection limit of SDSS r ~ 18.0. This puts many brighter transients within the reach of our instrument; we'll be able to provide high quality light curves for all objects before, during, and after any outburst or movement events.
Below is an movie generated from HATPI subtracted frames and then cut down to show a postage stamp of the recent nova Sagittarii 2015 3, which was in a field being monitored by the HATPI prototype instrument before and during its outburst phase. We will make such stamps publicly available for any part of the sky observed by HATPI within hours of the initial observations, allowing interested astronomers and citizen-scientists to track down any bright transient occuring in the Southern Hemisphere's night sky.
The figure below shows the light curve of the nova put together over nearly 2 months of continous nightly monitoring (except for bad weather).
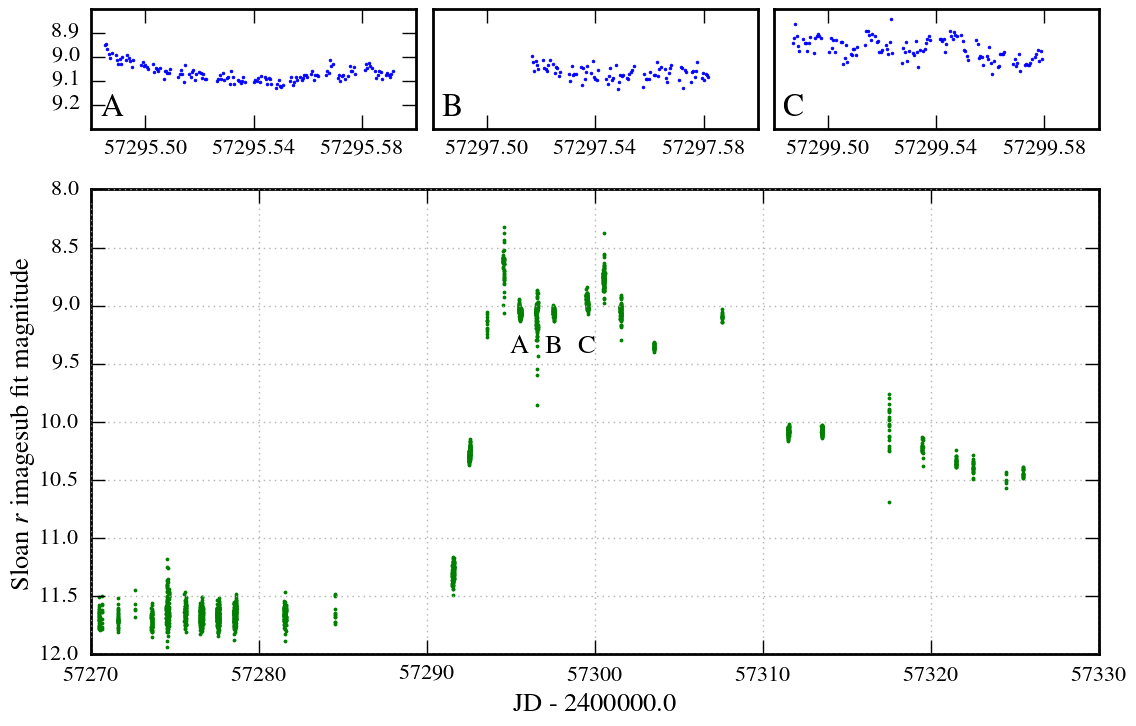
The insets show the high precision and cadence of these data
The extensive temporal and sky coverage of HATPI will also allow us to observe thousands of inner and outer solar system asteroids and minor planets. We'll be able to obtain light curves for most of these, as well as track their orbits. Below is an example of such an object, the near-Earth asteroid 2004 BL86 originally found in 2004 by the LINEAR survey. This object happened to be present in frames being taken for HATPI instrument testing during its closest approach to Earth in January 2015.
More information on the HATPI photometry pipeline and early science from its testing coming soon!
