I was involved in several related projects during my PhD thesis work at JHU (2006—2012):
- The Sloan Digital Sky Survey and Variable Point Sources
- Eclipsing Binary Systems in SDSS Stripe 82
- M-dwarf Eclipsing Binaries
The Sloan Digital Sky Survey and Variable Point Sources
The Sloan Digital Sky Survey (SDSS) is an imaging and spectroscopic survey of much of the northern sky in five photometric bands. It has been in operation since 1998, and has imaged about 14,500 square degrees as of the latest data release (at the time of writing), cataloging about 470 million unique objects in total. A significant portion of this imaging has been carried out in overlapping runs, which allows for the possibility of searching for astronomical objects that vary in brightness over time.
One area in particular has been observed at least 300 times over ten years, first as part of the regular SDSS imaging survey, then later as part of the SDSS-II Supernova Survey. This is SDSS Stripe 82, a 300 square degree region of sky on the celestial equator, ranging between 20 hrs and 4 hrs in right ascension and between -1.27 deg and +1.27 deg in declination. The observing cadence of this region is sparse and unevenly sampled, but still provides enough coverage to efficiently identify and characterize many time-variable astronomical sources. Because time coverage was the main focus of this part of the SDSS, the photometric precision suffers due to observing in less-than-optimal conditions. This leads to a large scatter in the time-series observations of the brightnesses of observed objects, which in turn hampers investigations into their actual variability.
Ensemble differential photometry
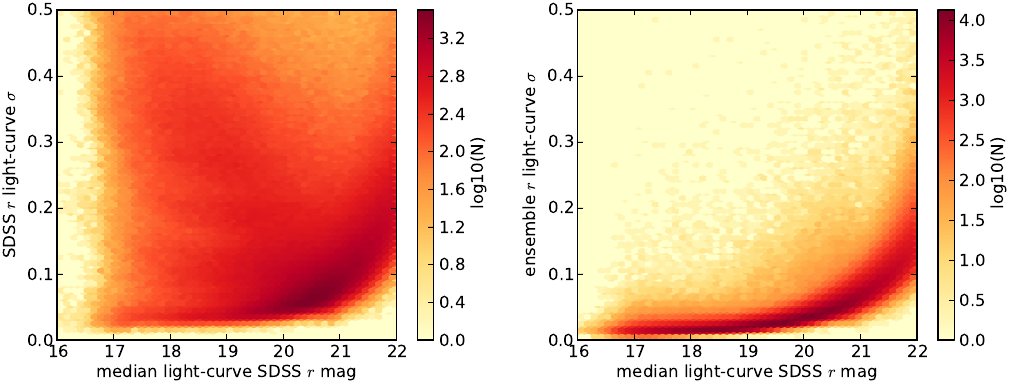
To get around this, we implemented a technique known as ensemble differential photometry, which corrects for variability induced by changing observing conditions, and thus reduces this scatter considerably. The figure below demonstrates the effect of carrying out this sort of photometry on the relation between the median brightness (magnitude) of the time-series and the root-mean-squared deviation (RMS) of the time-series. The magnitude-RMS relation often follows a polynomial curve as depicted below; objects with high RMS for their magnitude bin (and thus lying above the median trend) are usually suspected of being intrinsically variable, provided observing conditions remain constant. This isn't usually the case, however, and the light curve RMS includes effects from changing observing conditions, thus making it difficult to find actual variable stars. The left panel shows the relation as calculated for light curves generated from the SDSS photometry alone, while the right panel shows the relation after our ensemble differential photometry procedure. The large scatter in the RMS-magnitude relation is suppressed, improving our chances for finding real variability.
Classifying variable stars by color and type of variability
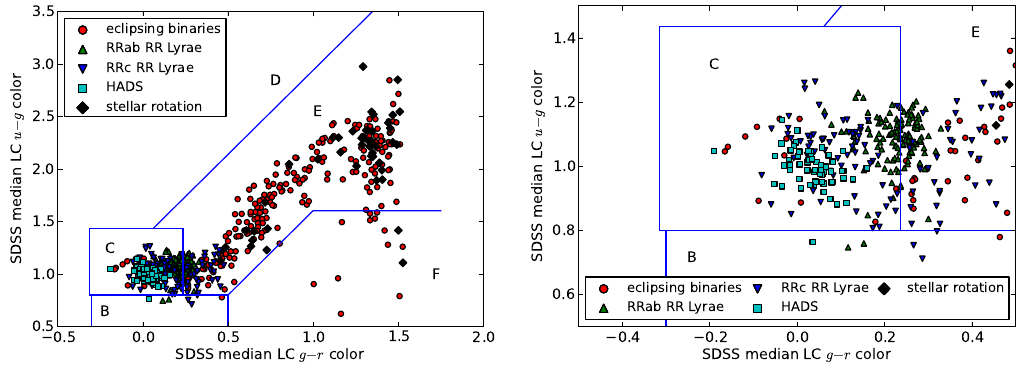
We constructed a ensemble differential photometry light-curve catalog of about 1.3 million point sources identified in Stripe 82 photometry and detected at least 10 times over ten years of observations. We then used this catalog to investigate the variability of stars. We found ~17,000 variable point sources in this data, to a limiting magnitude of SDSS r = 22.0 mag. Among these, we found 1,162 periodic variable stars. The figure below shows how these periodic variables are distributed in color space, separating them into rough classes.
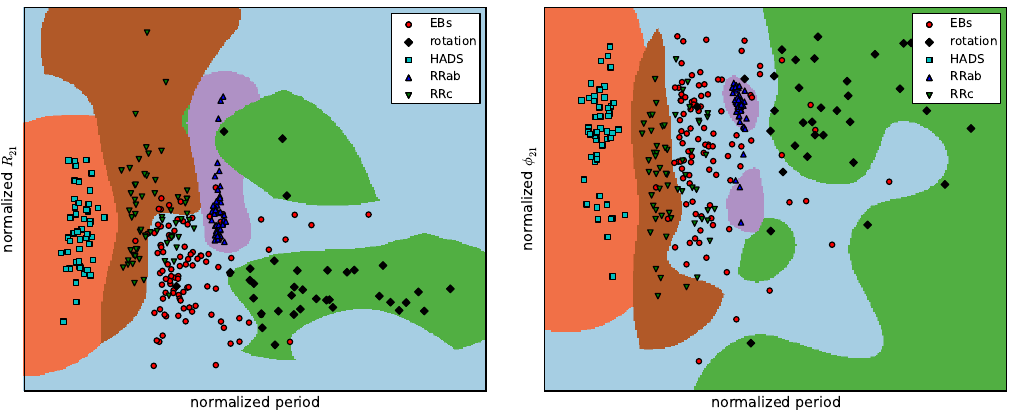
Properly classifying these is a time-consuming venture if carried out by humans, so we decided to use a machine-learning classification method known as Support Vector Classification (SVC), as implemented by the Python scikit-learn library. This involved training our classifiers on the colors, periods, and amplitudes of variability of a sample of high quality light curves of different classes of variable stars. We then used the trained classifier to obtain class probabilities for all periodic variables. The figure below shows the decision boundaries generated in variability period and amplitude space by SVC applied to our data.
The periodic variable star catalog
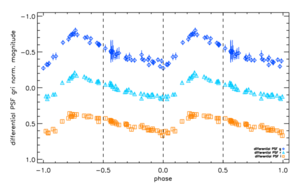
The periodicity and amplitude of variability of variable stars is often connected to their physical properties, and thus enables the measurement of these parameters. The figures below show examples of various types of periodic variables identified in our data. We have made a catalog of these objects publicly available as well:
The full light curve and variable star catalog
The light-curve catalog and information on all variable point sources found is publicly available. Use the links below to learn more:
- Read about the construction of the initial light-curve catalog
- Grab a copy of my PhD thesis to see how we constructed the final light-curve catalog
- Read the data release notes (including the full light-curve catalog)
- Get the variable star list in gzipped CSV format
Eclipsing Binary Systems in SDSS Stripe 82
The most fundamental properties of a star are its mass, radius, luminosity, and chemical composition. The mass and chemical composition directly affect the structure of the star, while the stellar radius and luminosity serve as indicators of its evolution through the various stages of its life. Unlike the Sun, most stars in the Galaxy do not have direct measures of these properties. Eclipsing binary systems (EBs) of stars provide a valuable means of measuring absolute stellar masses, radii, and luminosities (and chemical compositions in some cases) in a consistent manner, thus enabling detailed characterizations of these unresolved objects. These measurements then serve as important constraints on theoretical models of stellar structure and evolution.
EBs have their orbital planes aligned such that the component stars will be observed to periodically block the light from their companion; a distinct signal that may be monitored over time. Photometric monitoring and observations of the primary and secondary eclipses allow the determination of the stars' relative radii, luminosities, surface temperatures, orbital inclination, and eccentricity of the binary orbit. Spectroscopic observations provide an absolute scale for the system by the measurement of radial velocities, which in turn enable the calculation of the masses of the binary components. Additional information gleaned from spectra may include constraints on ages, chemical composition, and determination of the spectral type of the star.
For these reasons, EBs have been heavily studied and inform our current theoretical understanding of main sequence stars over a large range of stellar masses. These systems are rare, however, since the chances of any one unresolved object in the sky being an eclipsing variable are low. This difficulty is effectively overcome by large area time-domain surveys. We used our light-curve catalog of SDSS Stripe 82 point sources to search for periodic variable objects that appeared to be EBs and found nearly 300 examples of such objects in our data. See the figure below for examples.
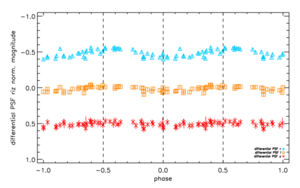
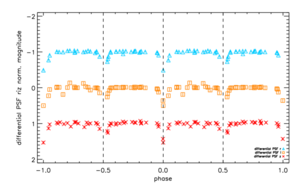
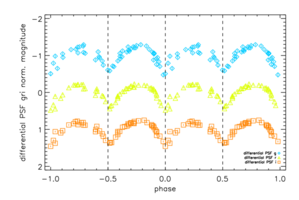
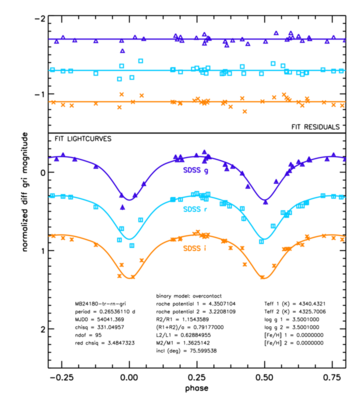
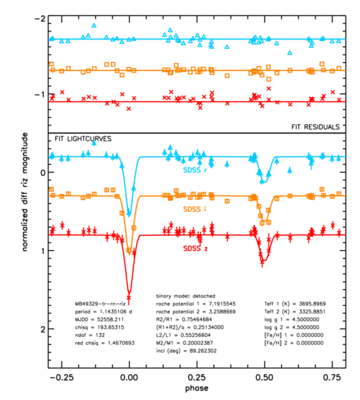
The sparse and uneven time-sampling of the SDSS Stripe 82 light-curve data makes it difficult to securely determine orbital periods for a large fraction of the eclipsing binaries in this sample. We identified a set of 70 EBs that appear to have good estimates of their periods and have enough phase coverage to allow the modeling of their light-curves by eclipsing binary codes. We used the Wilson-Devinney light curve modeling code (Wilson & Devinney, 1971) to calculate the relative properties of the binary system components. The figures below show some examples of the model fits carried out for these systems using our Stripe 82 ensemble differential photometry light curves. From these fits, we can obtain estimates of the physical properties of these binary systems, such as the mass ratio of the two components, the stellar effective temperature ratio, the inclination of the orbit, as well as the relative radii of the two stars in the binary.
M-dwarf Eclipsing Binaries
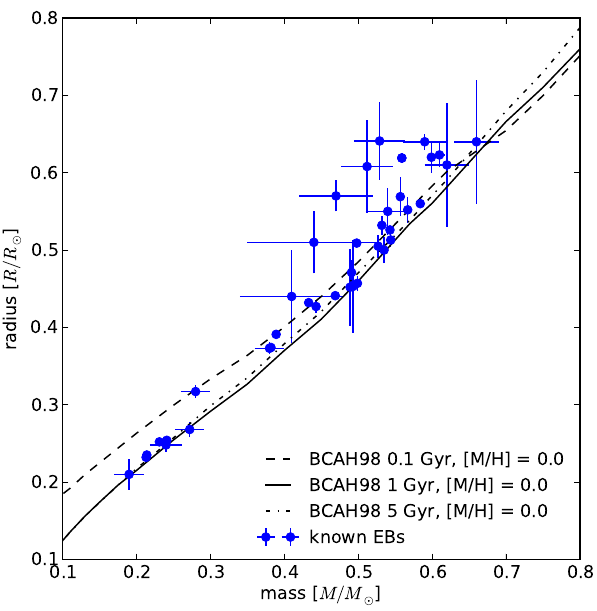
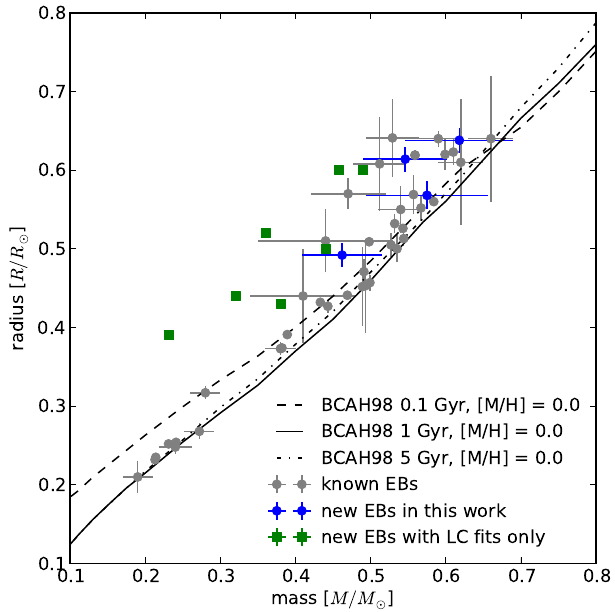
Observations of low-mass EBs (mass < 0.6 Msun) indicate that stellar radii of the binary components calculated by theoretical models of stellar structure and evolution (e.g. those by Baraffe et al. 1998) are systematically smaller (by ~10-15%) compared to stellar radii measured by observations of these systems (see Ribas et al. 2008 for a review). This represents a problem for exoplanet searches targeting these stars due to the possibility of discovering Earth-size planets in relatively close habitable zone orbits around these low-mass and long-lived stars (so the distance between the star and planet is such that liquid water exists on the planet's surface). If the measured radii of these low-mass stars disagree with models, any planets found in orbits around them will have discrepant measured radii as well (throwing their Earth-sized nature into doubt). The figure below illustrates the problem.
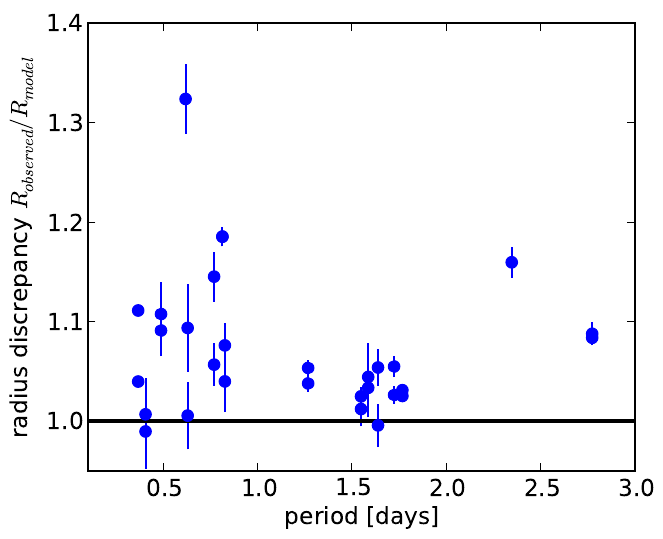
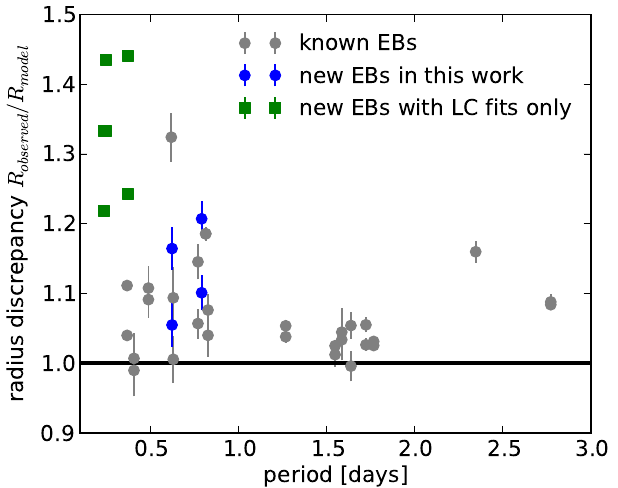
This discrepancy is thought to arise from the effects of tidal interactions in close binaries. These induce increased magnetic activity in the binary components, which leads to less efficient transport of energy to the stellar surface, and a corresponding 'inflated' stellar radius (Morales et al. 2008, 2010). A direct test of this hypothesis is to characterize the relation between the orbital period of observed EBs and the ratio of observed radii to model predicted radii. If the scenario postulated above is correct, there should be an increasing radius discrepancy with decreasing orbital period (and corresponding increasing strength of the tidal interactions). Indeed, there are hints that this might be the case, as seen in the figure below.
Unfortunately, the small number of objects in the low-mass eclipsing binary sample makes any trend in this relation difficult to discern. Serendipitous discovery of such EBs is difficult due to their intrinsic faintness and the low probability of favorable orbital alignment for eclipses to be observed. Both of these problems can be alleviated by using a large-area deep time-domain survey, such as our SDSS Stripe 82 light-curve catalog.
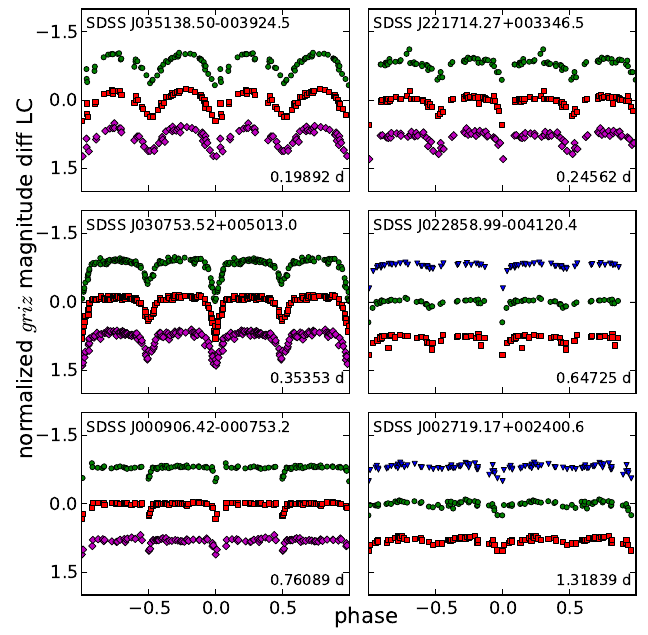
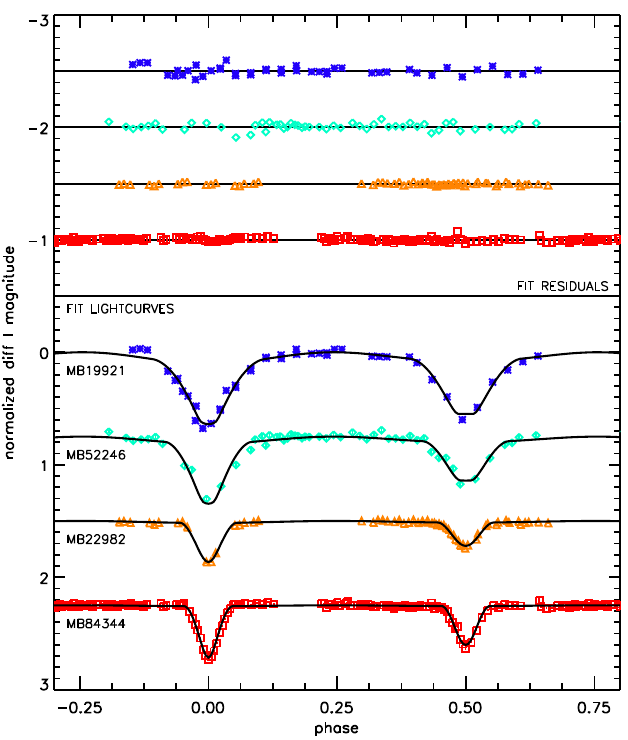
We selected five of the brightest M-dwarf EBs found during our search for periodic variables for extensive photometric and spectroscopic follow-up observations. We used the Apache Point Observatory 3.5-m telescope and the Kitt Peak National Observatory 2.1-m telescope for much of this work. The figure below shows high precision light curves and full eclipsing binary model fits for these objects.
For two of these objects, we also obtained sufficient spectroscopic radial velocity measurements so we could measure absolute radii and masses. These two M dwarf eclipsing binaries add to the existing sample of objects for which stellar evolution models under-predict radii. See the figure below for these added objects in context.
Furthermore, as the figure below shows, we find that adding our objects to the existing distribution of M dwarf eclipsing binaries in period vs radius-discrepancy space reinforces the earlier notion that shorter-period EBs have larger radius discrepancies. This then points to the explanation outlined earlier: low mass stars in tight orbits get spun up by each other, thus inhibiting energy transfer by convection to the stellar surface and depositing this energy in the stellar interiors. The end result is inflated stars.
See my thesis for final parameters for these stars and more details on all of the work leading from sparse time-series SDSS Stripe 82 photometry to low mass M dwarf eclipsing binaries.
