The data from the Kepler and K2 missions have revolutionized the study of variable stars in environments ranging from dense star clusters to sparse fields, and for a diverse population of stars covering a large range in ages and spectral type. The excellent precision of the light curves produced by the Kepler spacecraft, even after the loss of one of its reaction wheels, coupled with the long time base of observations greatly improves upon variable star studies from ground based surveys. Combining these high precision light curves with even longer time base light curves from ground-based time-series photometry surveys such as HATNet and HATSouth allows us to explore variable star populations previously difficult to characterize in either dataset alone.
The HATNet and HATSouth surveys have been in continuous operations since 2003, and have covered about 25% of the night sky between them. The photometric precision is perhaps the best of any wide-field ground-based survey so far. Several HATNet and HATSouth fields fall within the boundaries of the Kepler prime field in Cygnus, and also overlap with K2 campaign fields as the mission makes its way around the ecliptic plane.
I've been working on a project that combines HATNet, HATSouth, Kepler, and K2 light curves to explore the long term variability of stellar populations, as well as investigate trends and evolution in the period or amplitude of shorter term variability over many years. By putting together all of these light curves, we have the ability to monitor stars over a combined 12 years. Some straightforward applications include:
- getting complete phase light curves of red giant pulsating stars (Mira variables) that have extremely long pulsation periods
- investigating eclipsing red giant binaries with long periods; these give us a handle on distance to clusters via a period-luminosity relationship
- finding trends or modulations in variability epochs, amplitudes, or periods of variable stars over a long time base-line, which can indicate the presence of additional companions for short period binaries, and give insight into stellar structure for pulsating variables and rotating stars
The utility of combining ground- and space-based light curves is most easily demonstrated by taking into account that the K2 mission covers only up to 75 days per field. By adding HATNet and HATSouth light curves to K2 light curves, we'll be able to complete phase coverage of valuable long period eclipsing binaries and pulsating variables, thus increasing the value of K2 data products.
The overlap between Kepler/K2 and HATNet/HATsouth
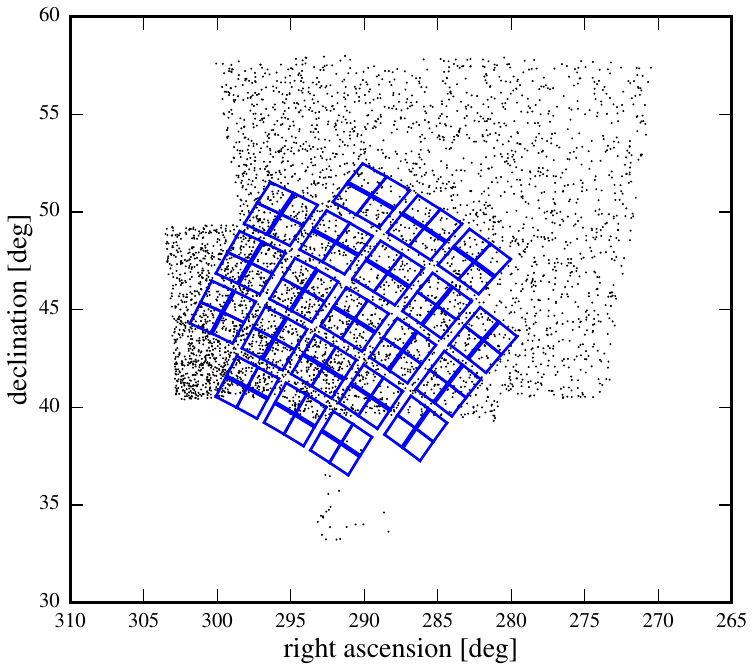
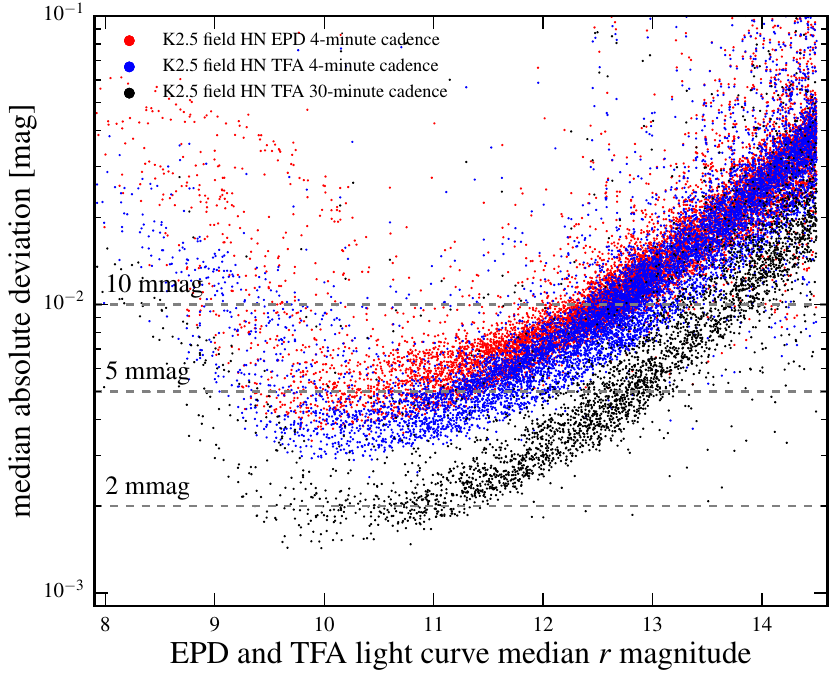
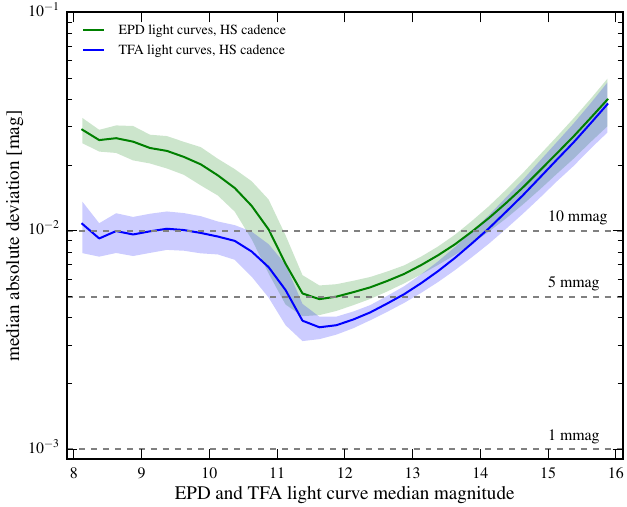
The left panel of the figure below depicts the overlap between the prime Kepler field and several HATNet observation fields that overlap. The right panel demonstrates the high precision of the HATNet light curves, especially when binned to Kepler-like 30 minute cadence. Getting as close as possible to Kepler precision allows us to stitch light curves from the two surveys correctly, apply model fits with more confidence, and obtain high-confidence estimates of stellar physical parameters.
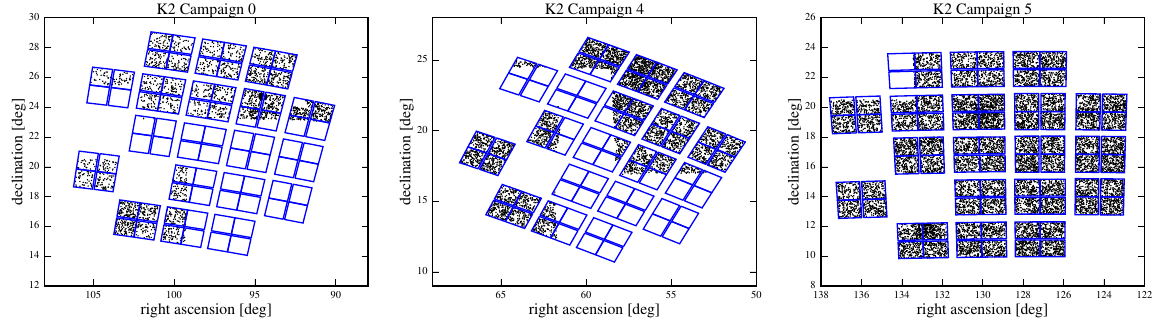
The figure below shows the overlap between three northern K2 fields and the HATNet survey. Fields of K2 Campaign 4 and 5 are especially interesting as they cover stars within the M67 and Hyades open clusters. Long term evolution of a large cohort of stars all (ostensibly) at the same age can be investigated most effectively by combining the HATNet and K2 light curves, allowing period searches and detection of secular trends over a much longer time base line.
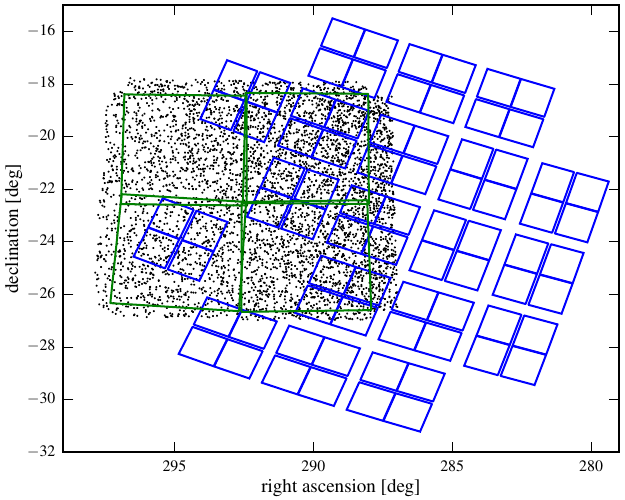
The left panel of the figure below shows the overlap between K2 observations of its Campaign 7 field which concide with HATSouth observations of a close-by field. The right panel of the figure shows the light curve precision in this field. Most notably, we are sensitive to variability to 2 magnitudes deeper than HATNet, allowing us to probe populations of redder and lower mass main-sequence stars.
Variable stars in the combined data
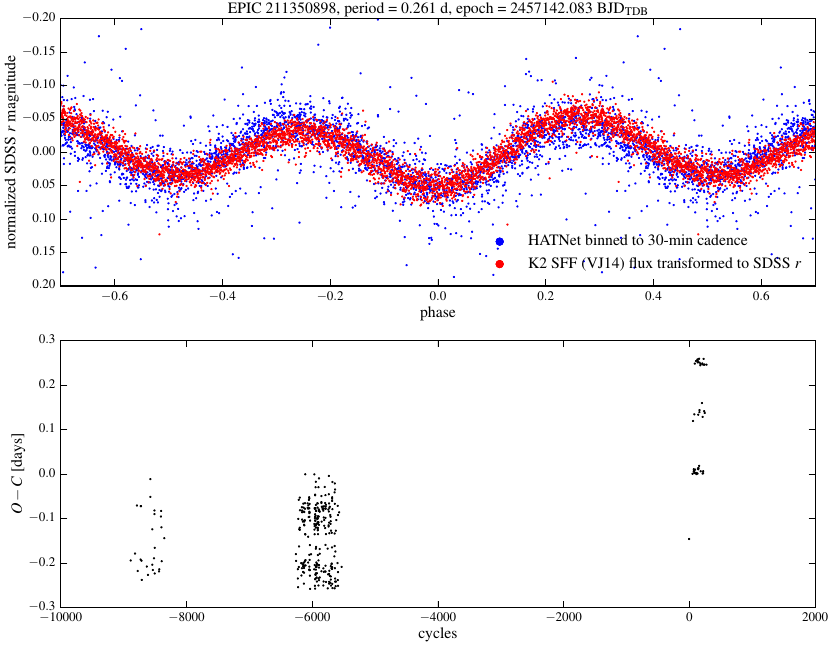
The figure below shows one example of the utility of the method outlined here. EPIC 211350898 is a contact eclipsing binary system matched between K2 and HATNet, with a combined light curve spanning nearly 10,000 orbital cycles (about 7 years). A secular change in the eclipse timing is easily seen over this range in time, perhaps indicating the presence of additional companions to this system.
More examples of combined light curves and their utility will be presented soon!
